Spoiler alert: There is no magic black box where a clod of soil or a plant leaf goes in and a bunch of numbers come out the other side.
Instead, lab technicians dry, grind and burn samples, as well as subject them to acid baths and other chemical processes, all the while maintaining identification and quality control protocols to ensure that the results capture the nutrients and other characteristics of the exact piece of land and/or plant from which the samples originated.
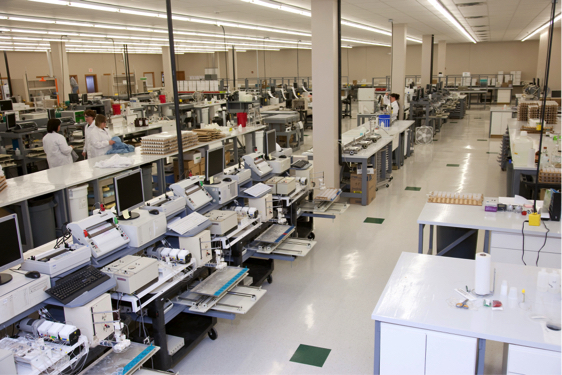
Photo credit: AGVISE Laboratories
Unfenced talked to two leading Midwest agricultural laboratories to give the reader a picture of what happens to that sample once it’s handed to the UPS driver. Soil scientist John Lee at North Dakota-based AGVISE and Randall Warden, president/CEO of Indiana-based A&L Great Lakes Laboratories, took us inside their operations.
At Warden’s A&L Great Lakes Laboratories, now entering its 40th year, the general processing for all soil samples begins when the sample enters the dryer and is heated to no higher than 105 degrees Fahrenheit, following standard procedures for the region. This minimizes the chance of potassium fixation.
Drying takes 8 to 16 hours. Once a sample dries, it goes through the grinding phase, during which the sample is put through a hammer mill specifically designed for soil samples.
“The entire sample is dried and ground,” Warden says. “We feel that’s very important. We recognize there is a lot of effort involved in collecting the sample, and whoever is submitting the sample feels it is representative, so we use the entire sample, and in no way sub-sample. Then we collect it and pass it through a 2-millimeter sieve, which produces about one cup of material.”
Just as nutrition is a common need for humans and plants, one of the central tools used to analyze nutrient levels in plants and soils is a high-tech device found in human medical settings.
“For both soil and tissue analysis, we use the same type of instrument that would be used in the hospital to test your blood,” says John Lee, from his lab in Northwood, North Dakota. “In the hospital, they want to check your blood for electrolytes, sodium — we use the same machine, called an inductively coupled argon plasma, or ICP. The plasma in the name is something farmers are familiar with; it’s like the plasma-cutting torch many farmers use — a flame. We extract the soil or the tissue, and we shoot the solution into this flame, and that energy excites the electrons in the solution to a higher energy state.”
When those electrons come back down to a steady state, they give off a specific wavelength of light. Sodium has a wavelength, potassium has a wavelength, and so on. Lee measures the intensity of that spectrum, and that tells him what’s in the sample.
This test is effective for most of the nutrients a farmer is concerned about, but one of the most important — nitrogen — requires another test. Nitrogen is measured with an instrument that uses a colorimetric approach. The soil is extracted with water before the concentration of nitrate nitrogen is measured (which represents the carryover nitrogen in the soil). This method turns the solution pink. The next instrument measures how dark pink the solution is, and compares the sample to standards with known concentrations.
Warden says they are conducting more and more testing for micronutrients.
“We have a basic soil test we refer to as ‘S1,’” he explains. “It includes buffer pH, a lime requirement test, organic matter, phosphorus, potassium, calcium, magnesium and cation exchange capacity. That is a basic test for this region of the U.S. We are seeing more and more people become interested in micronutrients like sulfur, zinc, manganese, iron, copper and boron — that’s our S3 test. Our S2 test is for western areas that may have some sodium or salinity issues. But that’s not very common in the Great Lakes region where we predominantly market.”
Organic matter levels govern the nutrient and water-holding capacity of soil, so its testing is important in judging the capabilities of the soil.
After the soil is dried, a portion is taken, weighed and then put into an oven to begin the process of testing organic matter, according to Lee, who points out that about two thimbles of dried and ground soil are used for this test. The computer takes the initial weight of that crucible. Then the sample goes in the oven for two hours at 360 degrees Celsius.
“During that time, a portion of that organic matter, what’s called the ‘easily oxidizable carbon,’ (EOC) burns off, and we let it cool and take a second weight,” Lee explains. “The weight loss is translated into a percentage of organic matter, based on calibrations we’ve done from hundreds of soil samples in the region, and how much EOC they lose during this process.”
Both Lee and Warden emphasize that an ag testing lab is not just a couple of guys swirling test tubes, but rather a process requiring many experienced hands.
“Quality control is very important,” Warden says. “The technicians have quality control samples — both known and ones they are not aware of. Their analyses aren’t released until they pass quality control; then, there is a quality control chemist who reviews all the data. Finally, we have an agronomist review all the reports. They look at it from a different angle, making sure it makes sense in the context of where the samples came from and knowing the characteristics of the soils there.”
Warden says a growing trend in the testing industry indicates a desire by growers to monitor fields more closely during the season by “enrolling a field” and collecting periodic plant tissue samples to be tested. It’s a highly involved management strategy most prevalent among potato growers, but making its way into other crops as well.
“For example, on potatoes, we often receive a tissue sample on a weekly basis,” Warden explains. “Then we generate a report that displays the data in both a tabular form and a graphical form for each element, so farmers can follow the nutrient trends through the season. Traditionally, that’s been done with potatoes, grapes and other high-value crops. Even corn and soybeans are being monitored now.”
Warden also notes that the timing of soil testing is shifting. “We are seeing more people in our region move to spring sampling — sampling in the planted crop. Just after planting, they can drive an ATV over the field and collect the samples. They know where the rows are, and they can avoid the starter fertilizer. They then get the soil analysis data, and they have all summer to decide what they are going to do. And immediately after harvest, they can begin their applications, because they know exactly what they want to do.”
For most farmers, paper reports are a thing of the past, and the trend is toward electronic transmission of the data, and lately, computer-to-computer communication to aid precision agriculture uses of the soil and tissue data.
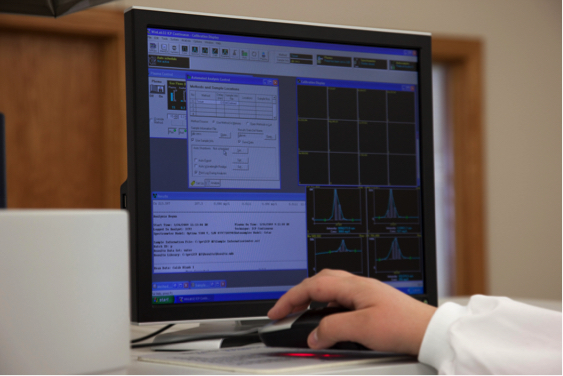
Photo credit: AGVISE Laboratories
Lee stresses the importance of keeping sample results straight, and describes the protocol used at both of AGVISE’s laboratories in Northwood, North Dakota, and Benson, Minnesota, in which every soil sample is identified with a unique bar code. When a sample is submitted it receives bar-coded soil sample reference numbers that go onto the sample bag. Those numbers are never used again.
“Through the last 30 years, we are up to using numbers in the 17 million range,” Lee says. “Nothing is ever duplicated. It greatly reduces the chances of errors.”