As the demand for food, feed, fiber and fuel increases to meet the needs of a growing global population, managing soil fertility becomes increasingly important. Not only must growers properly manage soil fertility to optimize its productivity, they must maintain soil nutrients and organic matter as part of comprehensive soil conservation efforts. Good soil nutrient management also is a key to high yields and farm profitability.
Soil testing is the first step to managing soil fertility. Information gained through this practice helps farmers and agronomy professionals design nutrient programs to match the exacting needs of individual acres or management zones as well as programs that may be appropriate across an entire field. Today, not only are farmers soil testing using more-detailed methods such as grid-sampling, they’re testing their fields more often.
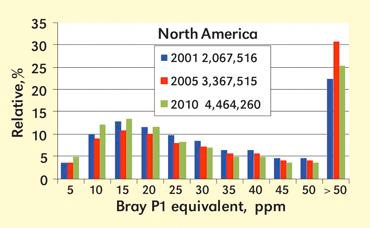
By summarizing the results of approximately 4.5 million soil samples collected in the fall of 2009 and the spring of 2010, then comparing them with a similar summary from 2005, the International Plant Nutrition Institute (IPNI) is bringing to light some interesting trends all farmers and agronomists should be aware of as they plan their crop fertility programs.
The summary of this report, entitled “The Fertility of North American Soils, 2010,” which can be found below, calls attention to broad nutrient needs and trends that are important to farmers and their advisers. Key trends include the following:
Phosphorus (P) soil test levels are dropping below the critical level, particularly in the Corn Belt.
-
The median P level for North America (NA) for the 2010 crop was 25 ppm, a 6 ppm decline since 2005.
-
The median P level for the 12 major Corn Belt states plus Ontario has declined from 28 ppm in 2005 to 22 ppm in 2010. This is very important because a high percentage of samples from this region now are below critical levels needed to meet nutrient management objectives for many crops.
The median P level for the United States and Canada (NA) declined from 31 ppm in 2005 to 25 ppm in 2010.
Median potassium (K) levels are very close to the critical level for crop response.
-
K test levels in the western Corn Belt and much of the Great Plains and Northeast experienced significant soil K declines.
The frequency of soils testing low in sulfur (S) is increasing, which is consistent with reports of increasing S deficiency in crops.
-
Some of the highest frequencies of low S occurred in the western Corn Belt and central Great Plains.
Many soils are expected to respond to supplemental zinc (Zn).
-
With 37 percent of samples testing less than one ppm Zn, and 16 percent testing less than 0.5 ppm Zn, many soils in North America should be responsive to Zn fertilization.
The northern Great Plains has a high frequency of soils low in chloride (Cl⁻).
The Fertility of North American Soils, 2010
By Paul E. Fixen, Tom W. Bruulsema, Tom L. Jensen, Robert Mikkelsen,
T. Scott Murrell, Steve B. Phillips, Quentin Rund and W. Mike Stewart
With the assistance and cooperation of numerous private and public soil testing laboratories, IPNI periodically summarizes soil test levels in North America (NA). Soil tests indicate the relative capacity of soil to provide nutrients to plants. Therefore, this summary can be viewed as an indicator of the nutrient-supplying capacity or fertility of soils in NA. This is the 10th summary completed by IPNI or its predecessor, the Potash & Phosphate Institute (PPI), with the first summary dating back to the late 1960s (Nelson, 1980).
The 2010 IPNI summary of 4.4 million soil samples is probably the most comprehensive evaluation of soil fertility ever conducted in NA. We said the same thing about the 2005 summary. Collectively, these two summaries examined nearly 8 million samples to offer a status report on one of the most precious natural resources of NA, its soil.
Submissions from laboratories indicate that use of soil testing has increased substantially since 2005. The 2010 summary gives a more complete evaluation of the components of soil fertility than previous summaries, providing information about phosphorus (P), potassium (K), sulfur (S), magnesium (Mg), zinc (Zn), chloride (Cl⁻) and pH.
Phosphorus.The median P level for NA of 25 parts per million (ppm) indicates a 6 ppm decline from 2005. The region of most consistent P declines was the Corn Belt, which also experienced a decline of 6 ppm to a 2010 median level of 22. This decline has major agronomic significance since a high percentage of samples from this region now test below critical levels and call for annual P fertilization to avoid yield reductions. Soil P declines across the Corn Belt were correlated with P partial balances, which were negative for the five-year period for 10 of the 12 states. The Northeast continues to have some of the highest soil P levels in NA, usually associated with intensive livestock or vegetable production.
Potassium.The median K level for NA declined 4 ppm, an amount numerically similar to the P decline.Yet at a median level of 150 ppm, the decline has much less agronomic significance. However, the current median is very close to what many recommendation systems consider to be an agronomic level critical to crop response. The western Corn Belt and much of the Great Plains and Northeast experienced significant soil K declines. Some of the apparent soil K changes are very likely due to factors other than nutrient management, such as weather patterns that can influence the equilibrium between soil- test-extractable and non-extractable forms of K.
Sulfur.The summary shows an increase in frequency of soils testing low in S, which is consistent with reports of increasing S deficiency in crops. Most scientists, however, do not consider S soil tests to be diagnostic without ancillary information, so agronomic interpretation strictly from the tests themselves is limited.
Zinc.With 37 percent of samples testing less than 1 ppm Zn, and 16 percent less than 0.5 ppm Zn, many soils in NA should respond to Zn fertilization.
Chloride.The northern Great Plains has a high frequency of soils low in Cl⁻.
pH.Soil pH changes, as in the past, were minor, with a NA median of 6.4, compared with 6.3 in 2010.
We in North America rely heavily on soil testing to assess soil fertility and guide future nutrient management decisions. This summary demonstrates the extreme variability of fertility levels and their changeability over time. Producers who seldom soil-test can gain much by getting into the regular practice of soil sampling. The increase in sample volume with the 2010 summary is a positive sign that more farmers and advisers are taking advantage of this valuable tool.
The 2010 summary includes results of tests performed by 60 private and public laboratories on approximately 4.4 million soil samples collected in the fall of 2009 and spring of 2010. Great appreciation goes to all the labs cooperating. Their assistance has resulted in the largest summary of soil samples ever conducted in the United States and Canada.
Though IPNI attempts to avoid distorting the data and conduct the summary comprehensively and consistently, weaknesses exist in the summary process due to the diversity and dynamic nature of soil testing services:
-
The quantity of contributed sample results is low in several states and provinces.
-
IPNI didn’t give the labs specific time frames. They were asked to contribute samples collected for decision making for the 2010 crop year, but the exact dates used in queries were left to individual interpretation.
-
Not all sample results could be definitively associated with a particular state.
-
It’s likely that the better managers regularly test their soil and that their results may not represent those who don’t.
-
Due to the requirement of nutrient management plans for many livestock operations, the percentage of samples in the summary from manured fields could be higher than in the past for some regions and inflate soil test levels, especially for P.
-
Summary protocol included separation of samples into manured and non-manured fields, but these categorizations were left to individual laboratories to define, and very few laboratories had those metadata.
-
Although researchers attempted to define calibration equivalency for each of the soil test categories among the various testing procedures, it’s likely that error was introduced into this process.
-
Some laboratory data were submitted using categories other than those specified in the sampling protocol, and interpolation routines were created and used to translate between the two systems.
Use of the summary and critical levels
To correctly use this report, readers should understand that nutrient management should occur on a site-specific basis in which management objectives and the needs of individual fields, and in many cases areas within fields, are recognized. Therefore, a general soil test summary like this one cannot reflect the specific needs of individual farms. Its value lies in calling attention to broad nutrient needs, trends and challenges, and in motivating educational and action programs that are in turn relevant to growers and their advisers.
Interpretation of the data reported here requires appreciation of the agronomic meaning of soil test levels. Critical nutrient levels are useful for that purpose. In this report, a critical level is defined as the level at which recommended nutrient rates generally drop to zero in sufficiency approaches or to a crop removal level in build-maintenance approaches. It is the soil test level below which nutrient inputs are required to meet soil fertility management objectives. These objectives vary among the states and provinces, with each representing considerations of short- and long-term profit, market and environmental risks, accuracy and precision in soil fertility assessments, as well as many other factors. Critical levels therefore vary from state to state since various aspects of management receive different levels of emphasis.
Critical Bray P1 equivalent levels for the soils and typical cropping systems of the Great Plains and western Corn Belt are usually assumed to be around 20 ppm and to increase to 25 or 50 ppm for the eastern United States. Certain crops, such as potatoes on some soils, will require much higher soil P levels, with research showing agronomic response in the 100 ppm range. Critical ammonium acetate K equivalent levels for the relatively high cation exchange capacity (CEC) soils of western and central NA are generally in the 120 to 200 ppm range. Critical levels are usually lower in eastern NA, and on low CEC soils may drop to 60 ppm.
State- and province-specific critical levels are available online (http://info.ipni.net/soiltestsummary).
Sample volume
Since the 2005 summary (PPI, 2005), it appears a substantial increase in use of soil testing has occurred, assuming that the summary continues to represent about 75 percent of the total samples collected. For example, the volume of samples in the 2010 summary from the Corn Belt region (12 states plus Ontario) is approximately 3 million, 50 percent higher than in the 2005 summary. This likely represents one of the highest growth rates in soil testing ever experienced in NA. Though the summary cannot show when the jump occurred during the last five years, it may have happened during the last year or two out of concern over the impact of recent nutrient use decisions on soil fertility levels and market-driven interest in improving future decisions. Growth in zone and grid sampling contributed to the increased sample volume.
Soil P
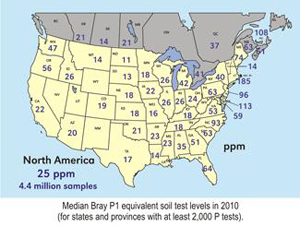
Figure 1: Median Bray P1 equivalent soil test levels in 2010 (for states and provinces with at least 2,000 P tests).
The median P level (50 percent of samples are above and below this level) for NA for the 2010 crop was 25 ppm, a 6 ppm decline from 2005. Phosphorus levels vary markedly among states and provinces (Figure 1)with the northern Great Plains generally having the lowest P levels, as has been the case in past summaries.
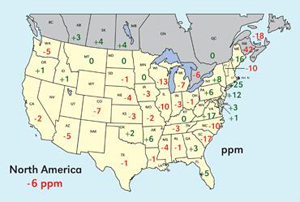
Figure 2: Change in median Bray P1 equivalent soil test levels from 2005 to 2010
However, unlike much of the rest of the intensively cropped regions of the country, this region tended to show increases in soil P, or at least no declines from the 2005 summary(Figure 2). Thus, the regional differences now are not as large as in the past. The far-eastern regions continue reporting the highest soil P levels in NA, with some medians climbing higher in 2010. The most consistent P declines since 2005 occurred across the Corn Belt and central Great Plains. The median P level for the 12 major Corn Belt states plus Ontario declined from 28 ppm in 2005 to 22 in 2010.
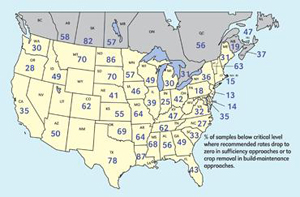
Figure 3: Percentage of samples testing below critical levels for P for major crops in 2010
This decline has major agronomic significance since a high percentage of samples from this region now test below critical levels (Figure 3). Considering that soil P levels are highly buffered, such large declines for a population of over three million samples over a five-year period are surprising. The high sample volume and limited diversity in cropping systems of the Corn Belt offer opportunities for additional evaluation of aggregate data to gain insights into the cause of these declines.
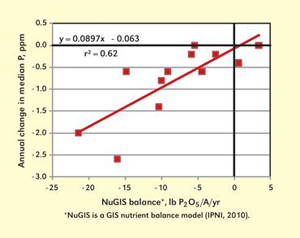
Figure 4: Annual change in median soil P level for 12 Corn Belt states as related to state P balance (fertilizer plus recoverable manure minus crop removal), 2005–2009
A separate IPNI project that’s evaluating partial nutrient balances in the U.S. (IPNI, 2010) was used to evaluate the relationship between P balance in the U.S. Corn Belt and changes in soil test P (Figure 4). The resulting regression coefficient indicates that 62 percent of the variability in soil P changes could be explained by state P balance, and the regression line passed very close to the origin, where a balanced P budget equates to no change in soil P. This is evidence that much of the measured decline in soil P levels comes from the cumulative effects of crop removal exceeding P use across this region.
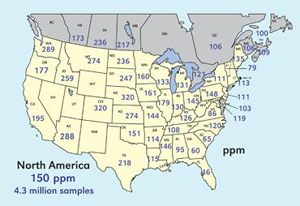
Figure 5: Median soil test K levels in 2010 (for states and provinces with at least 2,000 K tests)
Soil K
The median K level for NA for the 2010 crop was 150 ppm, a 4 ppm decline from 2005. Median K levels in many states east of the Mississippi River and in the provinces of eastern Canada are at or below agronomic critical levels, indicating that 50 percent or more of the sampled areas that were represented likely require annual K application to avoid yield losses (Figures 5, 7). The higher K levels in the West reflect the less weathered status of western soils.
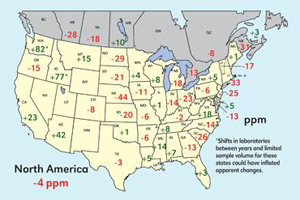
Figure 6: Change in median soil test K levels from 2005 to 2010
However, along the western Corn Belt and much of the Great Plains, crop removal rates far in excess of K additions (IPNI, 2010) are consistent with the declines in soil tests observed from 2005 to 2010 (Figure 6). Many areas in the Northeast also experienced significant K declines. In the Corn Belt, nutrient balance was not a good indicator of the observed changes in soil test K levels from 2005 to 2010, since it explained only 9 percent of the variability (data not shown). Though several shifts in K are larger numerically than the P changes, the agronomic significance of most of the Corn Belt K changes is considerably less than for P, especially when considering that the calibration scale for K is approximately 10 times that for P.
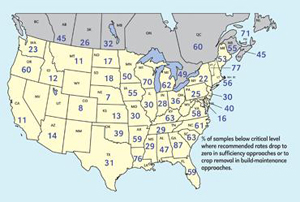
Figure 7: Percentage of samples testing below critical levels for K for major crops in 2010
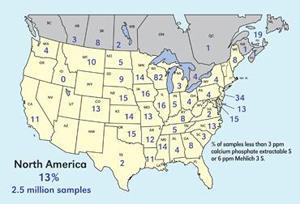
Figure 8: Percentage of soils testing less than 3 ppm S in 2010 (for states and provinces with at least 2,000 S tests).
Sulfur, zinc and chloride
Sulfur was analyzed on 2.5 million soil samples in the summary, with 13 percent testing less than 3 ppm calcium phosphate equivalent S (6 ppm Mehlich 3 S) compared with only 4 percent testing below this level in 2005. This level of soil S should not be interpreted as a critical level, but just to help identify areas with the highest frequency of low levels. Some of the highest frequencies of low S occurred in the western Corn Belt and central Great Plains(Figure 8), regions where reports of S deficiency in crops have been increasing.
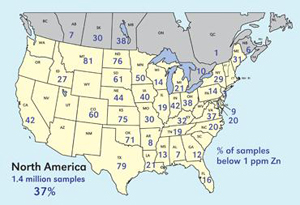
Figure 9: Soil samples testing less than 1.0 ppm DTPA equivalent Zn in 2010 (for states and provinces with at least 2,000 Zn tests)
This was the first Institute summary in which the surveyed number of Zn soil tests was large enough to justify reporting. Of the 1.4 million Zn tests received, 37 percent were less than 1 ppm DTPA equivalent and 16 percent were less than 0.5 ppm. A critical level for this test is often considered to be near 1 ppm, but considerable variation exists among crops and soils. The summary indicates that many soils in NA should be responsive to Zn application, especially for Zn-sensitive crops (Figure 9). Of the total number of samples submitted to the survey, about one-quarter contained Zn soil test information.
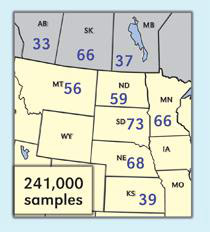
Figure 10: Percentage of soils testing less than 4 ppm Cl-
The low number of Zn tests may have been due to either fewer customer requests for this analysis or fewer laboratories opting to report the results in the survey. However, Zn soil tests are often requested when insufficiency is suspected, so it may be that the survey results are biased toward lower levels. The labs determine chloride levels primarily on samples from the northern Great Plains, where crops responsive to Cl- crops are grown on soils low in that nutrient. These tests show a high frequency of low Cl- levels (Figure 10).
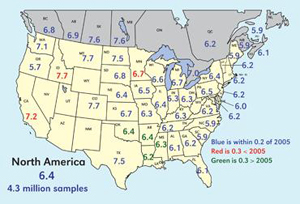
Figure 11: Median soil pH in 2010 and change from 2005 (for states and provinces with at least 2,000 pH tests)
Soil pH
The median pH for NA is 6.4, with 27 percent of the samples testing at less than 6. The pH of 6 appears highlighted because a pH at 6.0 ppm or above is desirable for most cropping systems. Median pH is lowest in the southeastern United States and generally increases toward the west (Figure 11). Median levels above but near 6 indicate that close to half of the surveyed population of tests in those states and provinces were acid enough that lime applications should be thoughtfully evaluated.
Dr. Fixen is IPNI senior vice president and director of research; email: pfixen@ipni.net. Dr. Bruulsema is IPNI Northeast Region director. Dr. Jensen is IPNI Northern Great Plains Region director. Dr. Mikkelsen is IPNI Western Region director. Dr. Murrell is IPNI Northcentral Region director. Dr. Phillips is IPNI Southeast Region director. Mr. Rund is with PAQ Interactive. Dr. Stewart is IPNI Southern and Central Great Plains Region director.
References
International Plant Nutrition Institute (IPNI), 2010. A Preliminary Nutrient Use Geographic Information System (NuGIS) for the U.S. IPNI Publication No. 30-3270. Norcross, Ga. Available online >www. ipni.net/nugis<.
Nelson, W.L. 1980. Better Crops 63(4): 6–10.
Potash & Phosphate Institute (PPI), 2005. Soil Test Levels in North America: Summary Update. PPI/PPIC/FAR Technical Bulletin 2005-1. Norcross, Ga.
Adapted from Better Crops with Plant Food, Vol. 94, Issue No. 4, 2010. Reference #10134/Nov. 2010
International Plant Nutrition Institute
3500 Parkway Lane, Suite 550
Norcross, GA U.S.A. 30092-2844
Phone: (770) 447-0335
www.ipni.net email: info@ipni.net