Soil testing is the farmer’s best tool for determining and managing phosphorus (P) levels in their fields. Testing can confirm increases in soil test phosphorus resulting from application of P and also document how much crop removal has decreased soil test phosphorus.
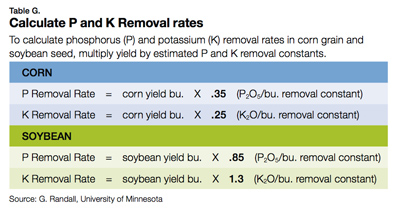
Unfortunately, in the last decade or two, soil test phosphorus has declined in many areas of the Corn Belt. The steady decline is generally due to increasing yields, which remove greater levels of P from the soil, coupled with P application rates that often have fallen below crop nutrient removal rates (Table G). This trend is particularly evident for rented land when the renter chooses to mine P from the soil rather than apply fertilizer or manure P at a rate sufficient to maintain soil test phosphorus at an optimum level.
Building P soil test values
Since nutrients removed by the crop need to be replaced by fertilizer or manure P to maintain soil test P values, farmers often ask, “How much phosphate will it take to raise my soil test phosphorus value to the optimum level?” This is a difficult question to answer, since the amount of P required depends on current and targeted soil test phosphorus levels, subsoil P level, depth of phosphate (P₂O₅) incorporation, and the crop yields and nutrient removal occurring during the time frame in which the soil test phosphorus is to be increased.
A common rule of thumb developed by University of Illinois researchers says 18 pounds P₂O₅ per acre will increase Bray P₁ by 1 ppm. In a 12-year Minnesota study during the 1970s and 1980s, with corn yields averaging 150 bushels per acre, Bray P₁ STP was maintained at 20 ppm with an annual 50-pounds-P₂O₅-per-acre rate. STP increased 1 ppm per year when an additional 30 pounds P₂O₅ per acre were applied annually. So you can see, given the many variables involved, annual soil testing is an excellent way to monitor changes in soil test phosphorus for each particular situation.
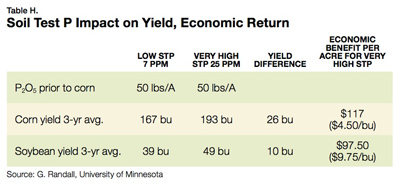
Recent research indicates high soil test P values may be necessary for economically successful corn and soybean production. A three-year study in Minnesota compared yields of corn and soybeans grown on low P-testing soil and very high P-testing soil. A 50-pounds-P₂O₅-per-acre rate was applied for corn each year followed by no additional P for soybeans the next year. All other inputs were similar across both soil test phosphorus regimes.
Table H shows the economic penalty (nearly $120 per acre per year) of low- testing compared with very-high-testing soils, even when P fertilizer is applied. This illustrates further that managing soil phosphorus levels is critical as farmers attempt to maximize the return on their fertilizer dollar. Knowing the soil test P status is especially important on rented or recently acquired acres. Simply said, high yields require high P uptake, which requires P to be available in the soil.
Maintaining high soil test phosphorus values gives growers the flexibility to skip P fertilization without sacrificing yield. Moreover, growers reduce the risk of failing to maximize yield in exceptional years by maintaining soil test phosphorus at high levels. Less-than-high soil test phosphorus values can easily limit yields, resulting in potential yield being left in the field. Finally, high soil test phosphorus gives extra resource value to the land, providing better return on investment to both the landowner and renter.