The status of soil fertility levels is an indicator of the sustainability of farming. Every five years, the staff of IPNI and cooperating private and public laboratories across the United States and Canada summarize soil test levels for phosphorus (P) and potassium (K) as well as pH to get an inventory of soil fertility levels across North America.
With decreased fertilizer use in 2009 and the long-term trend of crops removing soil nutrients faster than they’re being replenished, many are interested in the 2010 summary.
Tests confirm that soil test levels for P and K are falling in most of the Corn Belt.
First, the good news from this summary process is the substantial increase in use of soil testing since 2005; soil testing has grown at an average of about 300,000 samples per year over the past five years. We estimate that about 5.5 million samples were collected in North America for the 2010 crop compared with about 4 million for the 2005 crop. This is one of the highest growth rates in soil testing ever recorded in North America.
Unfortunately, the results of these tests confirm that soil test levels for P and K are falling in most of the Corn Belt.
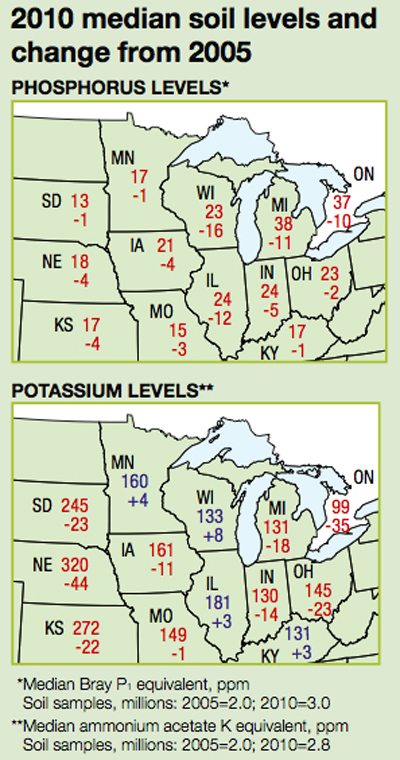
The two maps show median soil P and K levels (50 percent of samples are above and below these levels) for the Corn Belt states and Ontario. The lower numbers in the maps are the changes from 2005.
Phosphorus declined in all areas, with Wisconsin and the Northeast showing the largest drops. Soil P levels in the Western states were lower initially, so the three or four ppm reductions seen from the summary are important to note. Preliminary data indicate a large P-level decline for Illinois.
Soil K relative changes were smaller in comparison and less consistent. Nine of the 13 areas showed reductions or virtually no change, and four showed small increases. All three of the western-most states showed large drops in soil K because of highly negative nutrient balances, but their median levels still fall well above critical levels. The northeast states and Ontario also saw large reductions in soil K.
The takeaway is that crops are removing more P and K from many of the soils of the Corn Belt than those soils have been receiving as fertilizer or manure, and the result is declining soil fertility. The wide range of soil test results reinforces the importance of soil testing to determine fertility needs of specific fields and guide fertilizer and manure application needed for sustainable crop yields.