Many of the soils in North America, and around the world, have available phosphorus (P) levels that are at less than the optimum level — where crops will respond immediately to applied P fertilizer applications. The International Plant Nutrition Institute (IPNI), with the cooperation of numerous soil test laboratories in North America, conducts a summary of soil test results every five years. The results from our most recent summary in 2010 show that in many states and provinces, a large proportion of soils test below critical P levels, and supplemental P fertilizer applications are needed to achieve improved yields. For example, 70 percent of soils in Montana have levels where P fertilizer applications will immediately increase crop yields (Figure 1). For Montana soils, the critical level is defined as 20 ppm Bray P1 equivalent, but the median value in the 2010 summary was only 14 (Figure 2).
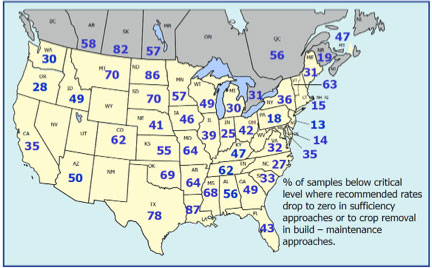
Figure 1. Percent of samples testing below critical levels for P for major crops in 2010.
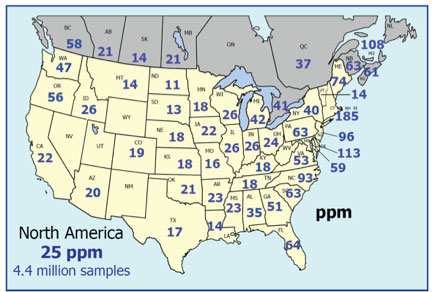
Figure 2. Median Bray P1 equivalent soil test levels in 2010 (for states or provinces with at least 2,000 P tests).
For most agricultural soils, only a small amount of soluble P is present and available to crops at any one moment. The majority of P is in (1) insoluble and (2) slow-to-become-available forms. The third labile pool of P can be dissolved into soil water as the concentration of soluble P declines due to crop root absorption. For example, a soil could have 2,000 lbs/ac of total P, with only 1 lb/ac soluble P; but fortunately, 40 lbs/ac of labile P can become plant available as crop roots continually absorb the soluble P. There are various soil analysis methods used in different laboratories that estimate the amount of labile P, and it is important that the selected analysis is appropriate for the soils in that region.
The ideal way to manage P in soils is to have a sufficient level of the labile P to supply crop needs over a growing season. This is what is meant in the above mention of 20 ppm Bray P1 equivalent for Montana soils. Soil analyses for labile soil P result in estimates of “plant available P,” and the exact critical level varies from soil to soil and for different crops. In most states and provinces, soil tests have been calibrated with field experiments measuring crop yield response to increasing rates of applied P fertilizer. These field experiments are used as guidelines for making fertilizer P recommendations. Soil analyses to monitor P availability are considered very reliable for most agricultural soils.
For soils testing below the critical level, annual P application rates should be greater than crop removal to gradually build up plant-available P. At or near the critical P level, annual P application rates should be close to crop removal rates to maintain P levels. Lastly, in soils testing higher than the critical level of P, annual P application rates can be less than crop removal to gradually draw down P levels.
Annual P fertilizer rates can be managed to gradually adjust soil test P levels toward the critical level. An example of how to monitor and adjust P fertilizer rates follows.
During the summer of 2013, I was asked to look at the levels of P from soil test results of 10 fields from a farm in central Saskatchewan. Normal crop removal of P in harvested grain from wheat and canola crops in the area ranges from 20 to 35 lbs P₂O₅/ac/yr, depending mostly on how much rain is received in this semi-arid region. The average soil test P levels were around 7 ppm, which is less than one-third the level of 25 ppm considered ideal for Saskatchewan soils. I asked the farmer what P fertilizer rates were being used. I was told that a liquid seed-row P fertilizer was being applied at 3 U.S. gals/ac, or 8 lbs P₂O₅/ac. I recommended they increase P rate applications to levels of around 40 lbs P₂O₅/ac to improve the P supply for crops and to gradually build up labile P in the soils on the farm. If, on average, 28 lbs of P₂O₅/ac is removed by crops in the area each year, the additional 12 lbs of P₂O₅/ac/yr applied at the 40 lbs P₂O₅/ac rate will build up soil P. This additional P applied will not change the soil test P level quickly, but about 2 ppm every three years at the higher annual application rate.
About the Author
Throughout his career, Dr. Jensen has been active in community and professional organizations, including recent service as a representative on the Nutrients in the Environment Committee of the Canadian Fertilizer Institute, the exam committee chairman of the Prairie Certified Crop Advisor Board (PCCA), and a member of the International Certified Crop Advisor Exam and Procedures Committee (ICCA). He is a Certified Crop Adviser and a member of the American Society of Agronomy, Soil Science Society of America, and Saskatchewan Institute of Agrologists.